Whitespace KPI Widget
The Whitespace KPI widget in the Springboard window displays a heat chart representing whitespace in the diary over a 14-day period.
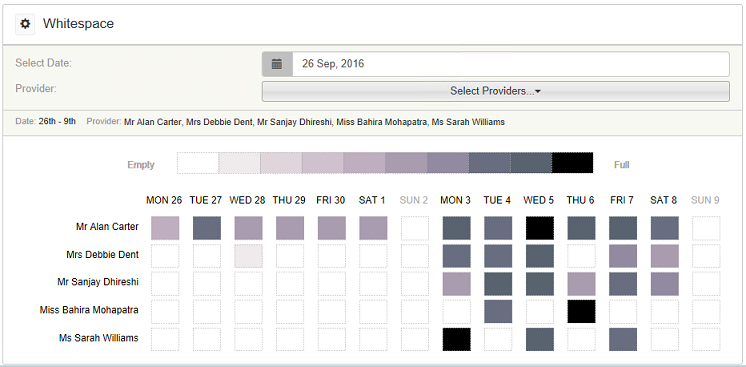
Depending upon the settings that have been applied by the system administrator, the window displays all users or just the logged-in user. You can click the View Filters icon to the left Whitespace to change the display to an individual user.
By default, the next 14 days are displayed, but click View Filters to select a different 14-day period.
If the you want to show the whitespace for a different date range, you can click on the View Filters box to the left of Whitespace and select the relevant dates.
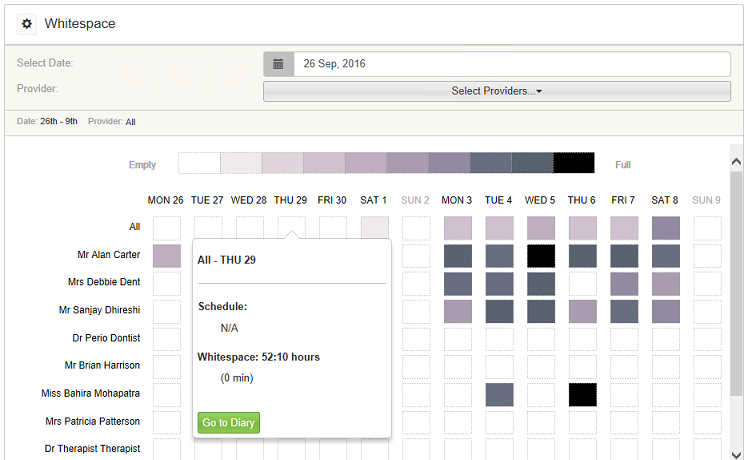
Each day is represented by a box, the colour of which represents the amount of whitespace there is on that day. The darker the colour the less whitespace there is. To see more information about the whitespace, hover the mouse over one of the boxes.
Hover the mouse over all providers to display a pop-up window that shows the total number of free hours in all diaries for that day. Click Go To Diary to go to the Planner for the selected date.
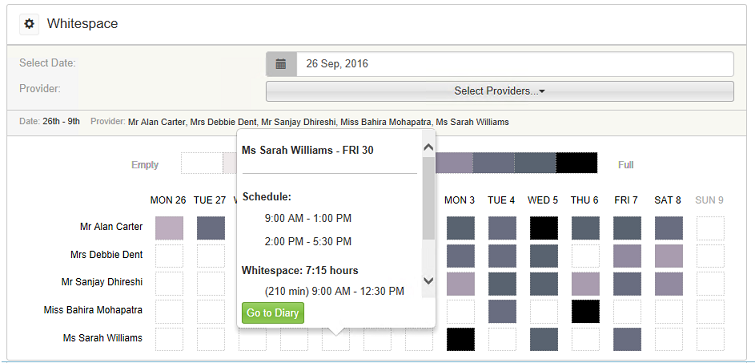
Hover the mouse over a box for a specific provider displays a pop-up box that shows the working pattern for that provider and the total amount of whitespace for that day. This information is broken down to show when there are unbooked times in the diary for the provider. Click Go To Diary to go to the Planner for the selected date.
Treatment Plan & Pipeline KPI Widget
Daily Revenue by Provider KPI Widget