Occupancy KPI Widget
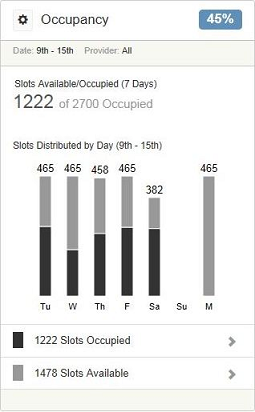
The Occupancy KPI widget in the Springboard window displays the number of slots available and occupied over a 7-day period, based upon the open diaries for the relevant days along with the percentage of slots that are occupied for the selected period.
-
This widget displays the number of slots available or occupied, not the amount of time available or occupied; therefore, it does not matter if the slot length is different for each provider in the Default Opening Hours.
Depending upon the settings that have been applied by the system administrator, the window displays information about all users or just the logged-in user. You can click the View Filters icon to the left of Occupancy to change the display to an individual user.
For each day, the total number of available slots at the practice are displayed in a bar chart. The light grey section of the bar represents the number of available slots, and the dark grey section of the bar represents the number of slots that are occupied. Hover the mouse over the relevant colour section to display the number of available or occupied slots for that day.
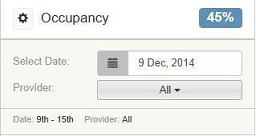
By default, the 7-day period starts on the current day and shows the slots for all providers, but this can be changed by clicking on the View Filters box to the right of Occupancy.
|
Select Date |
Click the calendar icon to select a different month. When a new date is selected, the bar chart automatically updates to show the available/occupied slots for the new 7-day period. |
|
Provider |
Displays a drop-down list of all providers with a diary. When a specific provider is selected, the bar chart automatically updates to show the available/occupied slots for the provider. |
The selections that you make remain until you close or reload the Springboard window, at which point they reset to the default values. It is not possible to change the default values permanently.
At the bottom of the window, you can see the total number of occupied slots and the total number of available slots for the selected 7-day period. Click on one of these totals to view the Planner for the first date in the bar chart.
Treatment Plan & Pipeline KPI Widget
Daily Revenue by Provider KPI Widget