Treatment Ranking KPI Widget
The Treatment Ranking KPI widget in the Springboard window displays details of the top items of treatment that have been performed per scheme over a specified period of time, along with the total value of the items. For England, Wales and Isle of Man NHS treatments, the total value is displayed as zero.
Depending upon the Springboard settings that have been applied by the system administrator, the window displays details about the treatment items for the practice or just the logged-in user. You can click the View Filters icon to the left of Treatment Ranking to change the display to an individual user.
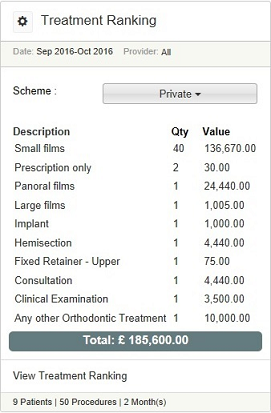
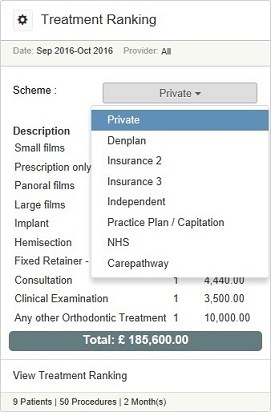
By default, when the Springboard window loads, it displays details for private treatment, but the treatment ranking for other schemes can be displayed by selecting the relevant scheme from the drop-down list.
Also, the default view is to show the treatment ranking for the previous two months, but clicking on the View Filters icon enables the user to select different start and end months.
The selections that have been made remain until Springboard is closed or reloaded, at which point it will reset to the default values. It is not possible to change the default values permanently.
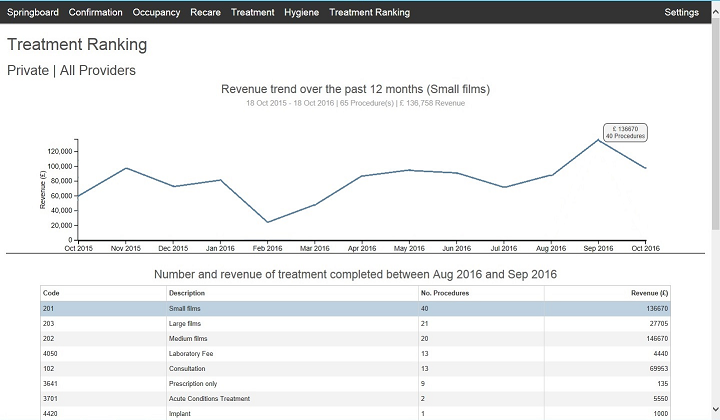
If you click the View Treatment Ranking button, you can see additional details about the treatment items. Select an item to display a graph showing the revenue generated by that item of treatment each month over the last 12 months. In addition, hover the mouse over any of the data points to display the total count and the total revenue for the relevant month.
Treatment Plan & Pipeline KPI Widget
Daily Revenue by Provider KPI Widget