Daily Revenue by Provider KPI Widget
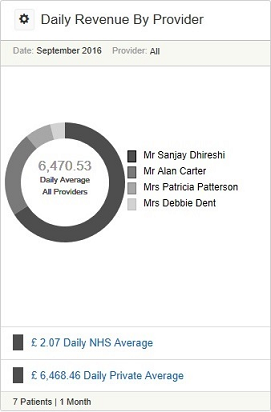
The Daily Revenue by Provider KPI widget in the Springboard window displays details of the daily average revenue generated by each user at the practice over their assigned working days during a specific month.
Depending on the Springboard settings that have been applied by the system administrator, the window displays details of the average daily revenue for all users at the practice or just the logged-in user. You can click the View Filters icon to the left of Daily Revenue By Provider to change the display to an individual user.
By default, when the Springboard window loads, it displays the details for the previous month, but clicking on the View Filters icon enables the user to select a different month.
The selections that have been made remain until Springboard is closed or reloaded, at which point it resets to the default values. It is not possible to change the default values permanently.
A donut chart is used to represent the daily average for each provider, with each provider having a separate colour. In the centre of the circle, the daily average for all providers is displayed; however, by hovering the mouse over the relevant colour in the donut chart, the information in the centre of the circle displays the daily average for that provider.
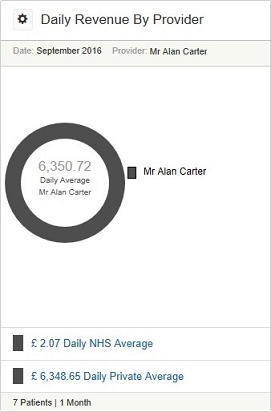
If the Personal Data Only restriction has been applied by the system administrator, then the donut chart and the information in the centre of the circle shows only the information for the logged-in provider.
Below the donut chart, depending upon the restrictions that have been applied, the Daily NHS Average value and the Daily Private Average value are also displayed, for all providers or for the logged-in provider.
Treatment Plan & Pipeline KPI Widget