Working with Images > Drawings, Measurements, and Annotations
Using the Isodensity Tool
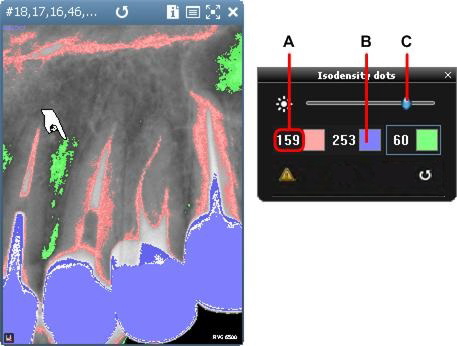
You can use the Isodensity tool to identify those parts of an image of similar density. Up to three different density levels can be displayed at the same time. The Isodensity tool helps to enhance the views of the tooth enamel, dentin, and pulp.
If the case of pathology, the difference in density can be shown in comparison to a healthy area.
You can also use the Isodensity tool to verify the integrity of an implant by analyzing the structure of the bone around the implant.
To show regions of similar density in an image, follow these steps:
-
Select the image in the Image Viewing Workspace or Darkroom mode.
-
In the
 Image toolbar, in the Density icon group, click
  .
.
|
|
Note: If a white triangle is displayed in the lower corner of the icon, you can access the different tools in the icon group. See Using Icon Groups. |
The Isodensity dots window is displayed.
-
Move the mouse pointer over the image. The mouse pointer changes to
 .
. -
In the image, click on a pixel point. All points in the image with similar color density are displayed in the first color.
The density value of your selection is displayed alongside the first color picker box (A).

-
Click on a second pixel point. All points in the image with similar color density are displayed in the second color.
-
Click on a third pixel point. All points in the image with similar color density are displayed in the third color.
|
|
Note: You can select up to three densities at the same time. Each density is displayed in a different color. The density value associated with each color is shown in the Isodensity dots window (A). |
-
You can also do any of the following:
-
To change a color associated with a point, click the color box (B) that you want to change. In the Color window, select a new color and click OK.
-
To adjust the sensitivity of the pixel ranges selected, move the slider (C) to the left to reduce pixels, and to the right to increase pixels.
-
To reset the Isodensity settings, click
 .
. -
To switch off the Isodensity function, in the Isodensity dots window click X.
Drawings, Measurements, and Annotations
Drawing a Multi-Segment Line (Polyline)
Adding a Text Annotation to an Image
Using the Undo and Redo Functions
Changing Object Color and Line Thickness
Using Measurements to Calculate Distances and Angles
Using the Densitometric Analysis Tool
