Working with Images > Drawings, Measurements, and Annotations
Using the Densitometric Analysis Tool
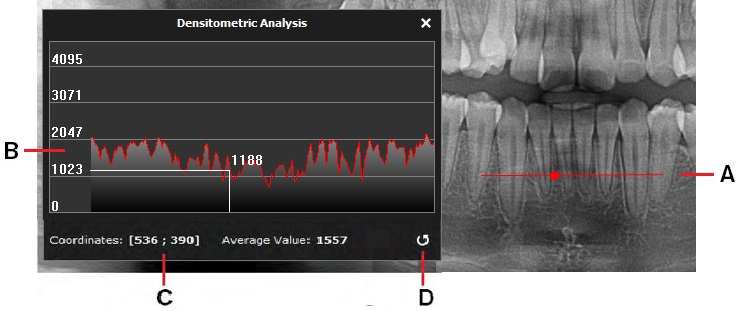
The Densitometric Analysis tool in the Density icon group allows you to analyze the relative density of tissue along a plotted section.
This grayscale allows you to compare two points on the same image. This is particularly useful for osteo-integration after an implant has been fitted.
You can also determine if a darkened area is an apical area, indicating a difference in the density of the bone in that area.
|
|
Tip: To view the ideal bone density for a patient, perform an analysis at the dentin-enamel junction and redo the analysis at the patient’s real bone level. |
To analyze image density, follow these steps:
-
Select the image in the Image Viewing Workspace or Darkroom mode.
-
In the
 Image toolbar, in the Density icon group, click
  .
.
|
|
Note: If a white triangle is displayed in the lower corner of the icon, you can access the different tools in the icon group. See Using Icon Groups. |
The Densitometric Analysis window is displayed.
-
Draw a section line on the image by clicking and dragging from an initial point and releasing at another point.
-
To establish the grayscale value at a given point along the line, click and drag the dot (A) along the plotted line until it is positioned over the required point.

The position of the dot is plotted continuously along the graph (B) in the Densitometric Analysis window. The X and Y coordinates are shown (C). The value of the grayscale at the selected point is shown.
-
To clear and start new measurements of point values, click
.png) (D).
(D). -
To close the window, click X.
|
|
Note: If you apply a filter or effect to the image, the Histogram is updated automatically with the grayscale of the selected pixel. |
|
|
Important: The grayscale values obtained using the Densitometric Analysis tool do not represent actual bone density values and are dependent on image contrast. |
Drawings, Measurements, and Annotations
Drawing a Multi-Segment Line (Polyline)
Adding a Text Annotation to an Image
Using the Undo and Redo Functions
Changing Object Color and Line Thickness
Using Measurements to Calculate Distances and Angles


