Working with Images > Adjusting Color Images > Using the Histogram
Using the Transfer Function in a Histogram
In a Histogram, you can click and drag the Transfer function to do the following.
|
A |
Adjust brightness by clicking and dragging horizontally (left to increase, right to decrease). |
|
B |
Adjust contrast by clicking and dragging vertically (up to increase, down to decrease). |

If you adjust the brightness, contrast, and gamma controls, the Transfer function curve will change.
|
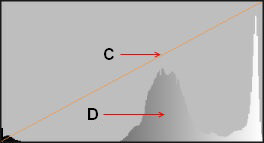
Transfer function (C) |
x-axis (horizontal) |
Grayscale level (black = low, white = high) |
|
y-axis (vertical) |
Pixel luminance (brightness) |
|
|
Histogram (D) |
x-axis (horizontal) |
Grayscale range (from black to white) |
|
y-axis (vertical) |
Number of pixels |
|
|
Note:
|

Using the Dental Arch Indicator in the Image Viewing Workspace